How to Read the Market Report

Every figure on the report, in the order you meet it.

Last updated:

HelpThe market report

Every month, the whole DHA Lahore market on one page: what a marla costs in each phase, which blocks are dearest, what buyers are asking for. This guide explains every figure on it — where it comes from, what it means, and which figures are not there yet.

01

The masthead

4
01

What this report is

One page a month that says what the whole DHA Lahore market did — built from our own live listings and our own field survey, not from anybody else’s guess.

  1. Open Market Report from the top menu, or go to /market-report.
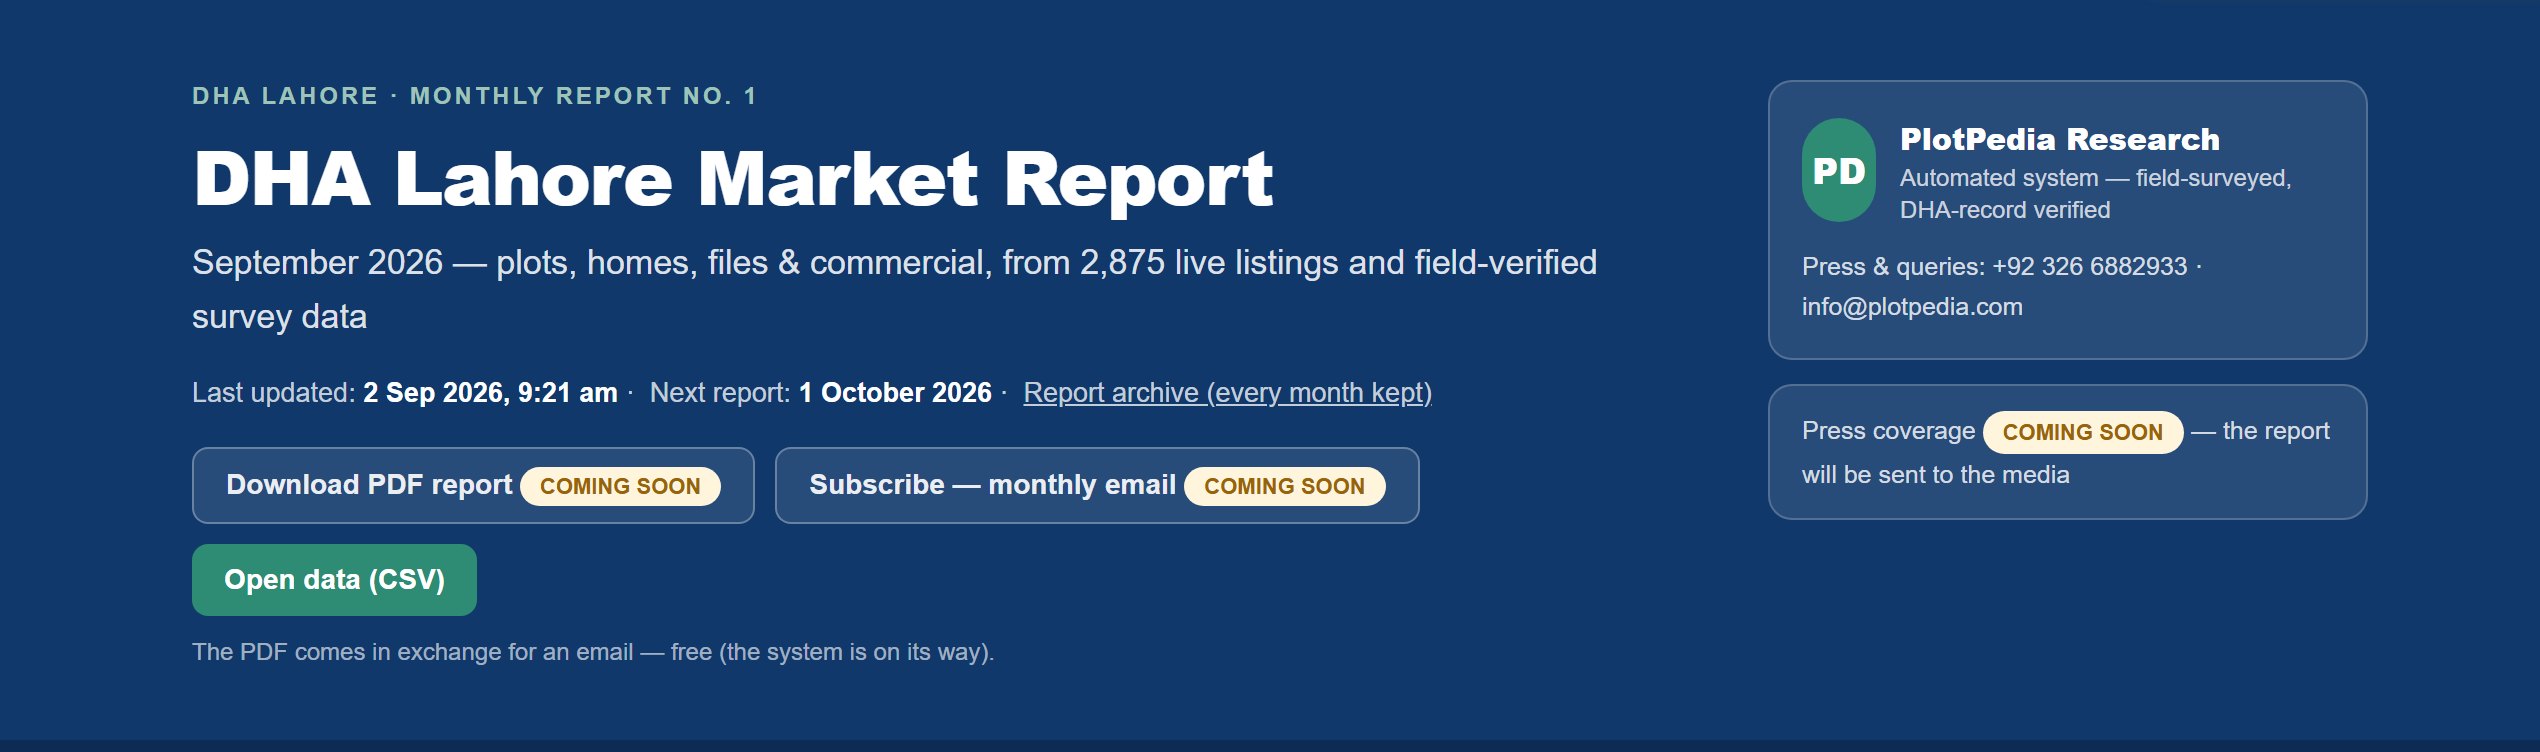
  2. The dark masthead names the month and the report number.
  3. Under it: how many live listings the month was built from.
  4. Everything below is worked out from those listings the moment you open the page — nothing is typed in by hand.
A rule we keep: no figure on this page is invented. Where a figure is not ready yet, you see a dash and a Coming Soon mark — never a made-up number.
Try it yourself
02

The three dates, and the archive

A report is only worth as much as its date. Three of them sit right under the title.

  1. Last updated — the date and time the figures on this page were worked out.
  2. Next report — the first of next month, when the new one appears.
  3. Report archive — press it to read any earlier month.
  4. Each month is kept for ever. Nothing is overwritten, so you can always compare last month with this one.
The figures refresh through the month as new listings arrive — the report is not frozen until the month ends.
Try it yourself
03

Open data — take the whole thing away

Three buttons sit in the masthead. One works today and it is the most useful of the three.

  1. Open data (CSV) — press it and the whole month of figures downloads as a spreadsheet file.
  2. Open it in Excel or Google Sheets and work on it yourself; it is free and nothing is asked of you.
  3. Download PDF report and Subscribe — monthly email are marked Coming Soon; they are not built yet.
  4. The PDF, when it comes, will be free in exchange for an email address.
We are the only site in this market that hands over its own figures. If you are a dealer, a bank or a journalist, that CSV is yours to use.
Try it yourself
04

The verified line — the one figure to quote

A dark strip runs across the bottom of the masthead with a star. It carries the figure that makes this report different from every other rate list in Pakistan.

  1. It reads, for example: ★ 3,282 listings (28%) matched against the DHA record.
  2. That means: for those listings we found the plot number in DHA’s own record and checked the size against it.
  3. The percentage matters more than the count — it tells you how much of this report stands on the record rather than on a dealer’s word.
  4. Wherever the dealer’s size clashes with the record, the site shows the record’s size and says so openly.
Nobody else in this market checks rates against the DHA record. That is why this line sits in the masthead and not buried below.
Try it yourself
02

The six big figures

4
05

Live listings, and how many moved in 24 hours

The first tile, and the one that tells you whether the rest of the page is worth reading.

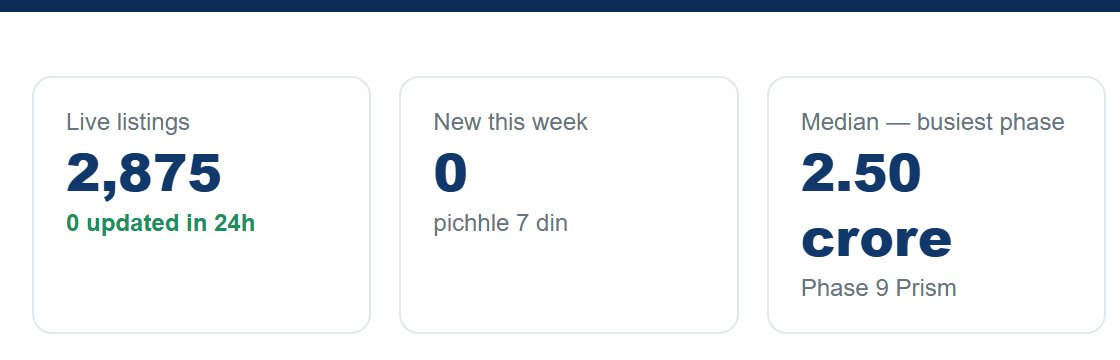
  1. The big number is every live listing the report is built from.
  2. Under it, in green: how many of those were updated in the last 24 hours.
  3. A big total with a tiny 24-hour figure means a quiet market; a high 24-hour figure means the market is moving today.
  4. Every other figure on this page is worked out from this same set of listings.
Try it yourself
06

New this week, and active dealers

Two tiles that together tell you how much fresh stock came in, and how many people are working the market.

  1. New this week — listings that came into the market in the last 7 days.
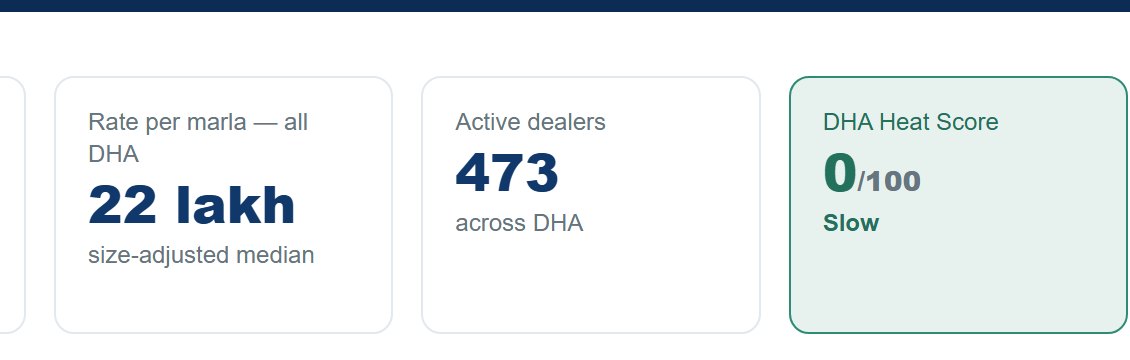
  2. Active dealers — how many different dealers have live listings right now.
  3. Divide one by the other and you know whether stock is coming from everybody or from a few busy offices.
  4. That division is done for you further down, in the Supply section.
Try it yourself
07

Rate per marla — the one number that compares everything

The single most useful figure in the whole report. It is what lets you put a 5 marla plot and a 2 kanal plot on the same scale.

  1. The tile reads, for example, 26 lakh — that is the middle rate per marla across the whole of DHA.
  2. It is size-adjusted: worked out so that a handful of very large plots cannot drag the figure up.
  3. Use it as your yardstick — anything far below it is worth a second look, anything far above needs a reason.
  4. Each phase has its own per-marla rate in the table below; this tile is all of DHA together.
Total price tells you what you pay. Rate per marla tells you whether you are paying too much. Learn to read this one and the whole market gets simpler.
Try it yourself
08

The Heat Score — is it a seller’s market today?

One number out of 100 that sums up whether the market is hot, balanced or slow. It is worked out from how much is moving, not from anybody’s opinion.

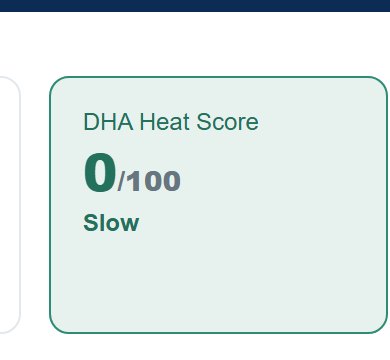
  1. The last tile reads a number out of 100 with one word under it.
  2. 60 and above — Seller’s market: stock is moving, sellers have the upper hand.
  3. 40 to 59 — Balanced: neither side has the advantage.
  4. Under 40 — Slow: listings sit longer, there is room to bargain.
  5. It is built from fresh listings, how many were updated, and how fast new stock arrives.
Treat it as a mood reading, not a promise. A single block can be hot while the score says slow.
Try it yourself
03

Reading the prices

5
09

First, four words you need

The tables use four words over and over. Learn them once and every figure below opens up.

  1. They appear as column headings in the phase table — this is what each one means.
WordWhat it means
MedianThe middle price. Line every listing up cheapest to dearest and take the one in the middle. One 20-crore plot cannot drag it up.
AverageAll prices added up and divided. One very expensive plot does drag this up — which is why we lead with the median.
25% / 75%A quarter of listings are below the first figure; a quarter are above the second. Between them sits the honest middle of the market.
Per marlaPrice divided by size, using the DHA record’s size wherever we have it.
When the median and the average are far apart, a few very dear listings are sitting in that phase. That gap is itself worth reading.
Try it yourself
10

The Price Index

A single line that will show whether DHA as a whole got dearer or cheaper. It is the only section whose chart is still waiting.

  1. The base is set: September 2026 = 100. Every later month is measured against it.
  2. A daily snapshot of the whole market has been kept since 12 September 2026 — the record is already building.
  3. The chart draws itself the moment the first full month of snapshots is complete.
  4. Three chips above it — Price, Price / marla, Index value — will switch what the line shows.
An index needs time before it means anything. We chose to show you the empty frame honestly rather than draw a line from two days of data.
Try it yourself
11

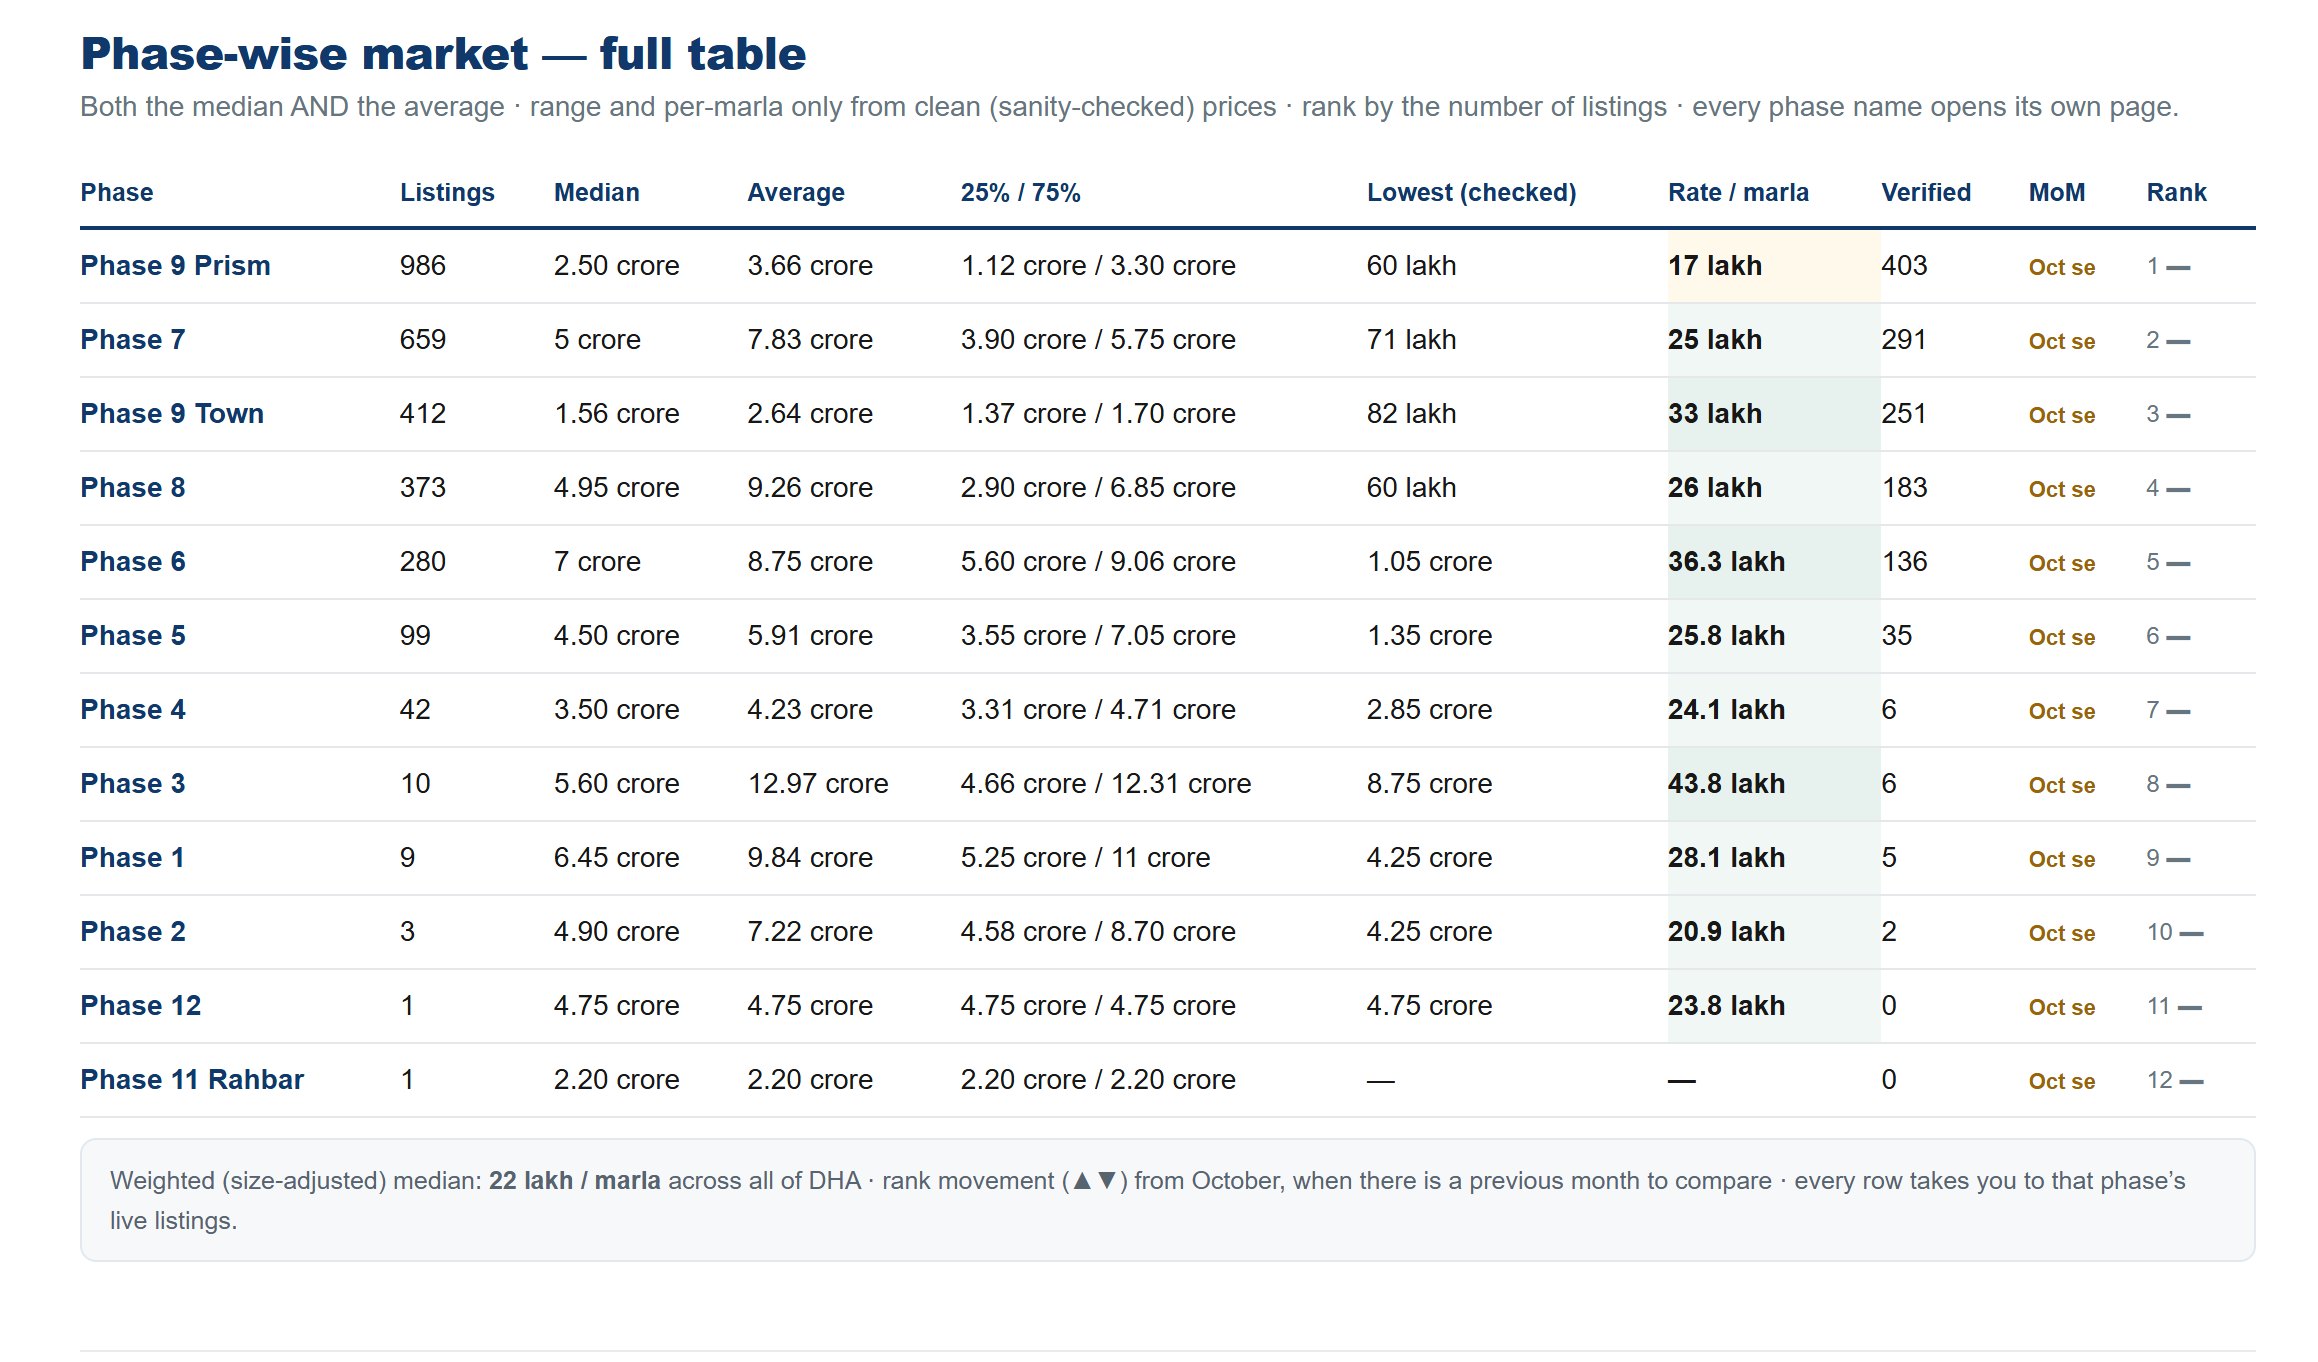
The phase table — the heart of the report

Every phase of DHA on one grid, ranked. If you read only one thing on this page, read this.

  1. Each row is a phase: how many listings, the median price, the average, the 25% and 75% marks, the cheapest, the rate per marla, and how many are verified.
  2. Rows are ranked by how many listings a phase has — the busiest phase first, not the dearest.
  3. The MoM column and the ▲▼ marks show movement from last month — they begin the moment there are two months to compare.
  4. Press any row to open that phase’s live listings.
  5. The line under the table gives the size-adjusted median for all of DHA together.
Compare the per marla column down the rows, not the median. Median prices differ mostly because the plots are different sizes.
Try it yourself
12

The price map — price by colour

The same phase rates drawn as colour, so you can see the shape of the market instead of reading numbers.

  1. Each phase is filled by its rate per marla: the deeper the green, the dearer.
  2. Pale sand colour means the cheapest end of DHA.
  3. Four chips sit above it — Rate / marla works today; change %, demand and new supply are Coming Soon.
  4. For the plot-by-plot map, press Open the Plot Finder underneath.
This map is for the shape of prices. The Plot Finder is for finding one plot — two different jobs, two different maps.
Try it yourself
13

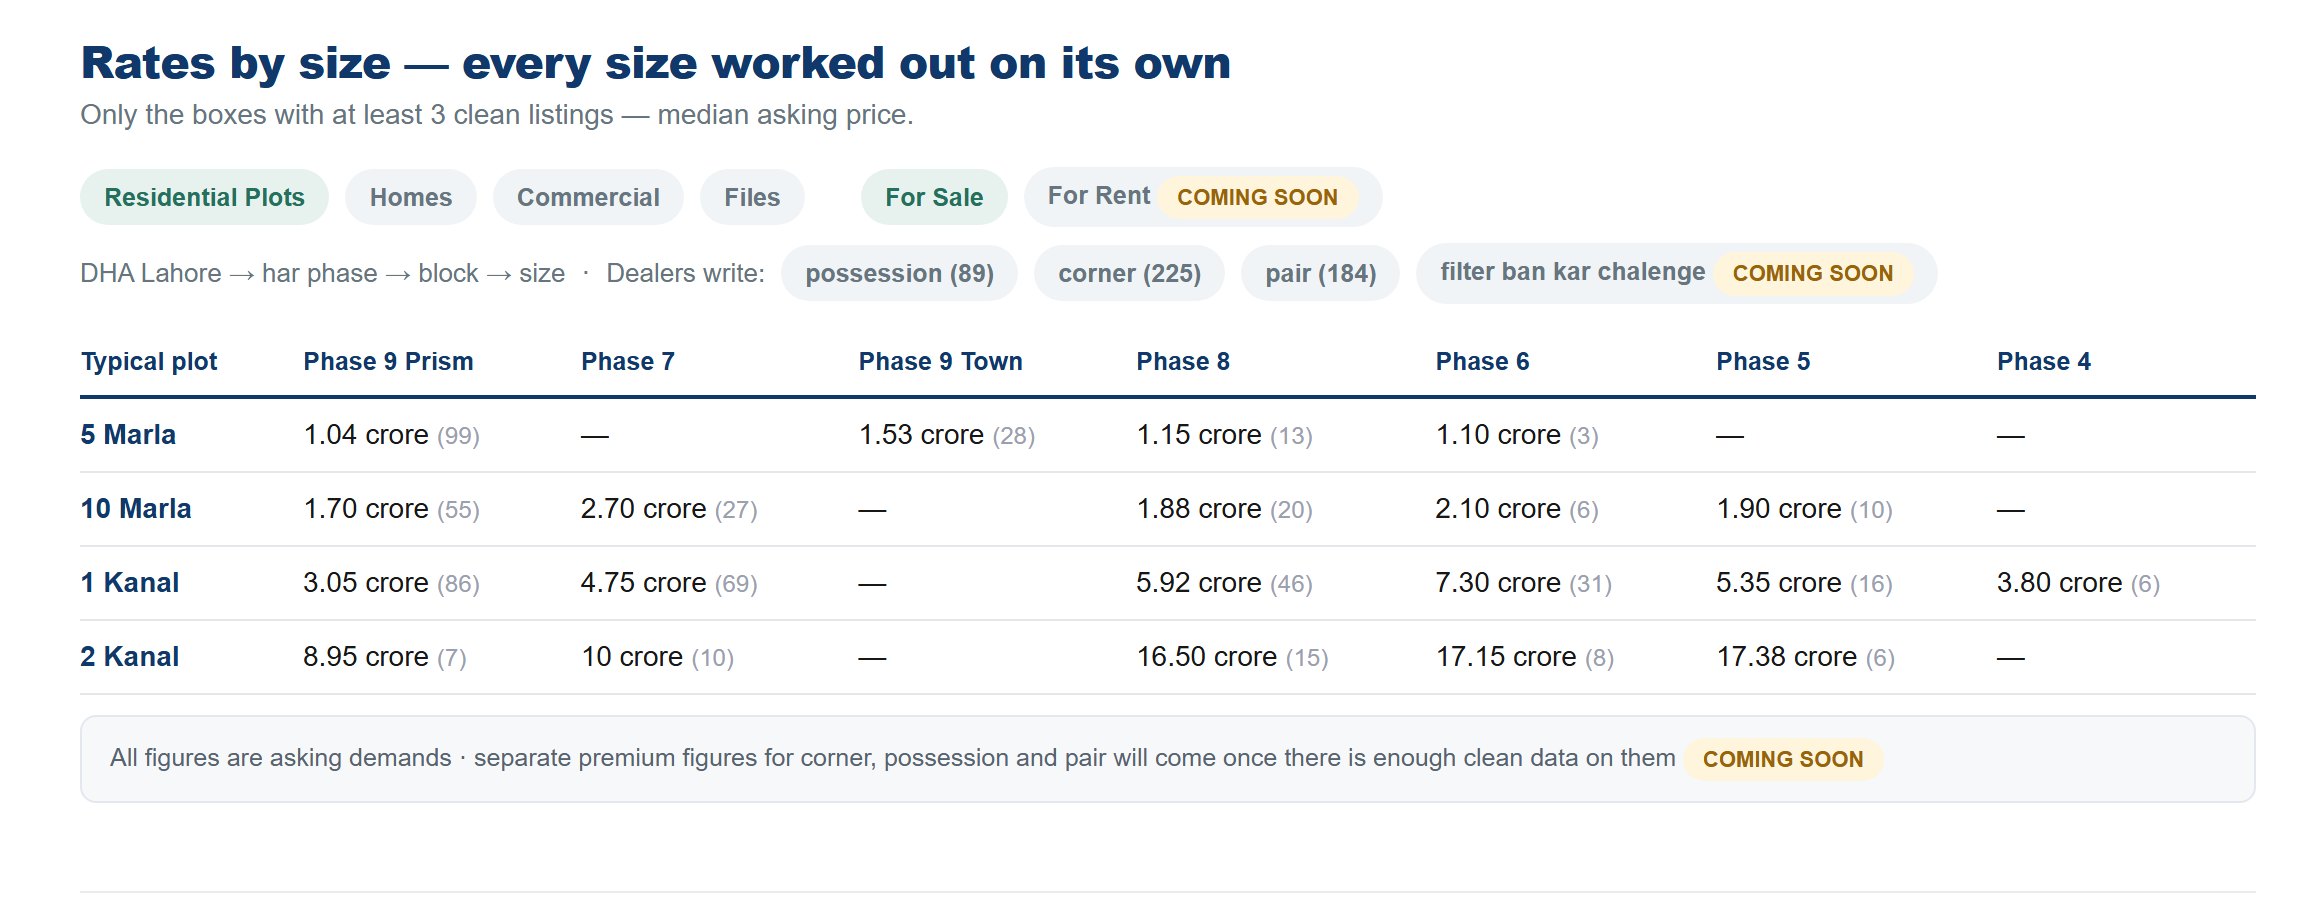
Rates by size — each size worked out on its own

A 5 marla plot and a 1 kanal plot in the same phase are two different markets. This grid keeps them apart.

  1. Rows are sizes, columns are phases; each box is the median asking price for that size in that phase.
  2. A box only appears when there are at least three clean listings behind it.
  3. Press a box to open those listings; press a size name to open that size’s own rate page.
  4. Chips above switch between Residential Plots, Homes, Commercial and Files.
  5. Corner, possession and pair chips show how many exist — they become filters later.
Empty boxes are not a mistake. They mean that size barely trades in that phase — which is useful to know before you go looking for one.
Try it yourself
04

Supply and demand

3
14

Supply — how much stock there is

Six tiles about what is on the market. Two are live today; four wait on sold data.

  1. Listings per dealer — the total divided by the number of active dealers.
  2. New listings (7 days) — fresh stock that arrived this week.
  3. Months of supply, Withdrawn, Supply Index and Supply on the way are faded with a Coming Soon mark.
  4. Those four all need one thing: a record of what actually sold. Once sold-marks go in, they fill themselves.
Try it yourself
15

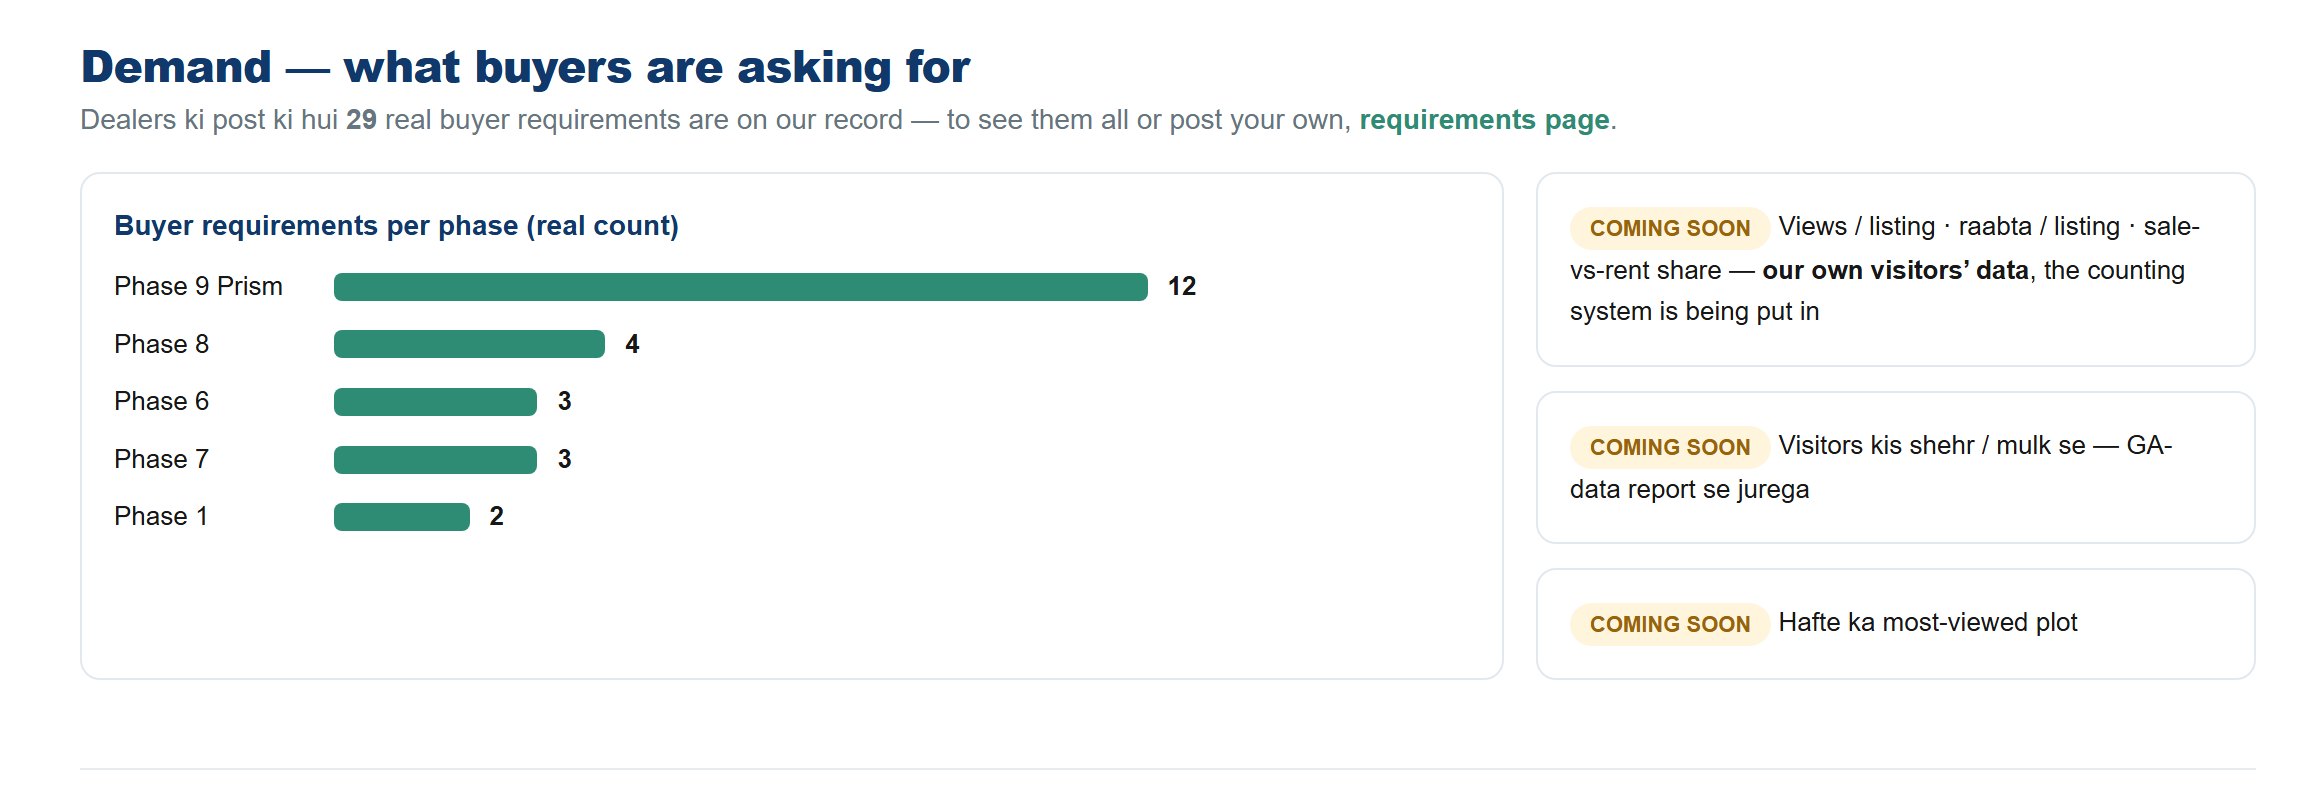
Demand — what buyers are actually asking for

Not a guess about demand — the real requirements dealers and buyers have posted on our own board.

  1. The line above says how many real buyer requirements are on record.
  2. Below, they are broken down by phase — which phase people are asking about most.
  3. Press requirements page to read them all, or to post your own.
  4. Posting is free and needs no name — only what you want and a way to reach you.
This is the other half of the market. Every other rate list shows you what is for sale; almost none show you what people are looking for.
Try it yourself
16

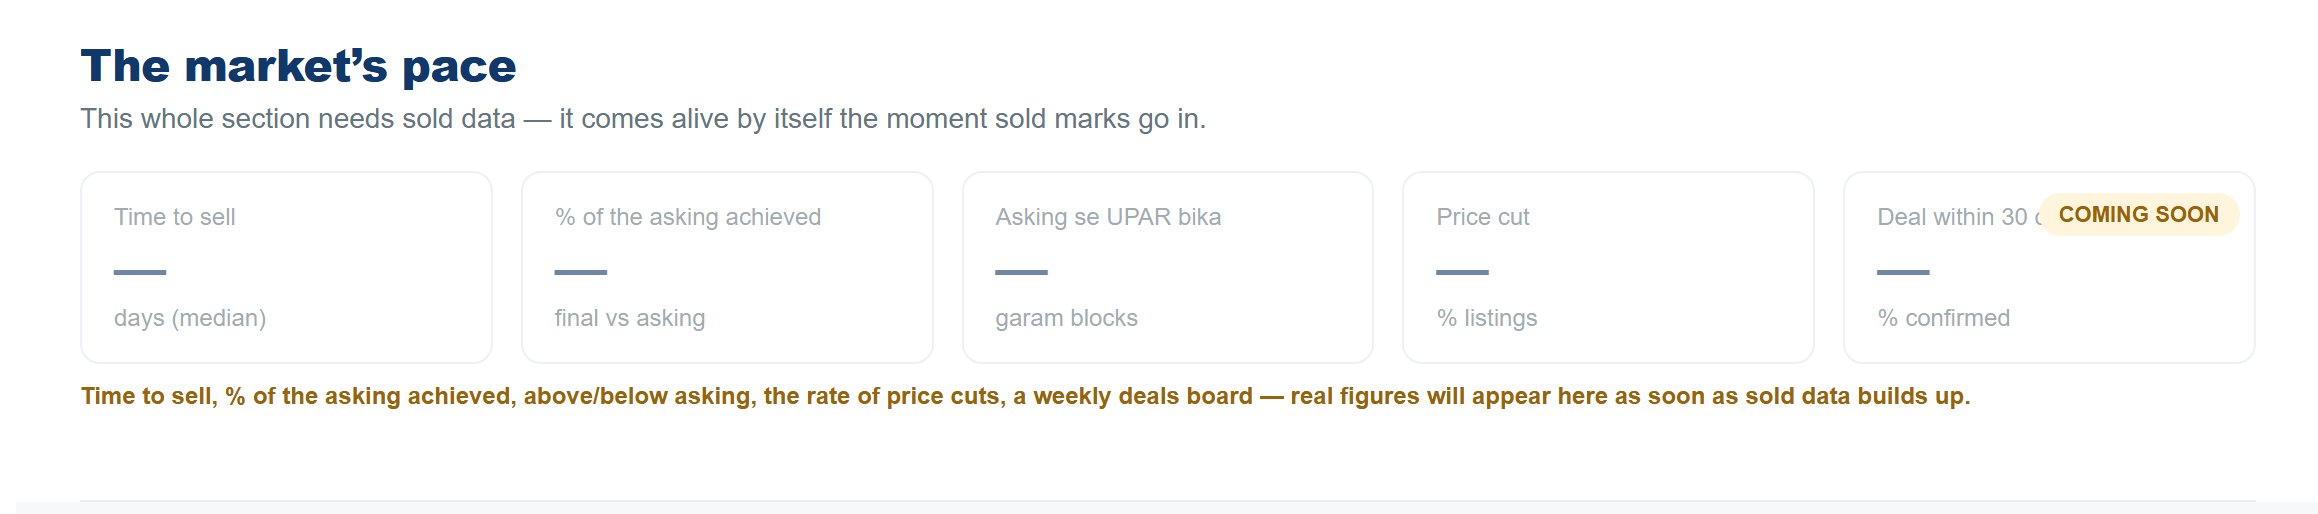
The market’s pace — the section that is waiting

How fast things sell, how long they sit, how far the price moved between asking and closing. All of it needs one thing we do not have yet.

  1. The whole section is shown faded with Coming Soon.
  2. It needs sold data — a record of what actually closed, at what price, after how many days.
  3. In this market that information is not public, so we are building it ourselves through our own confirmed deals.
  4. The design is finished. The moment enough sold-marks are in, this section fills itself with no further work.
We chose to show you the empty frame instead of hiding the section. You can see exactly what is coming and why it is not here yet.
Try it yourself
05

Trust, rankings and the rest

4
17

Verified data — what "verified" actually means here

The section that explains the claim in the masthead, in plain words.

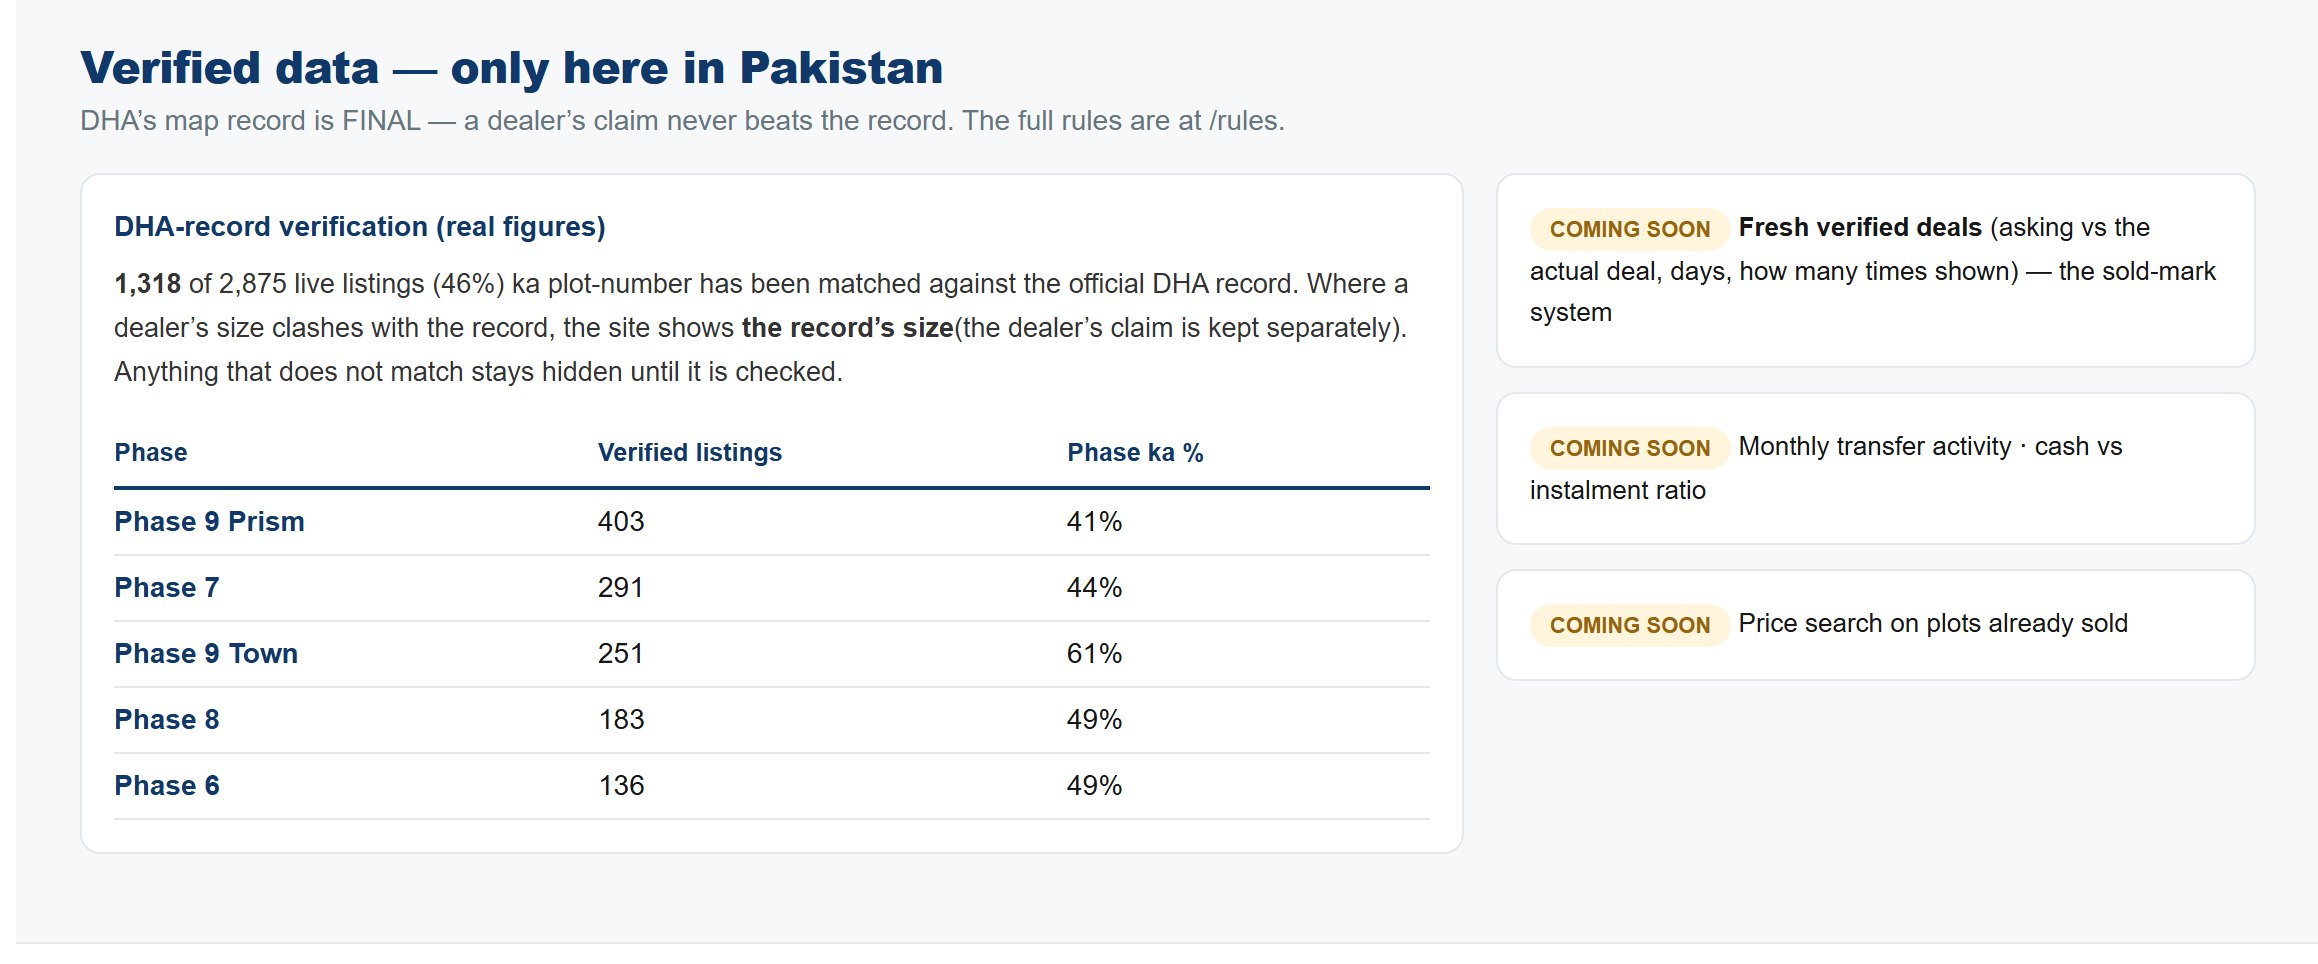
  1. It repeats the count and the percentage matched against the DHA record.
  2. It states the rule: DHA’s map record is final — a dealer’s claim never beats the record.
  3. Where the two clash, the site shows the record’s size and says openly that the agent wrote something else.
  4. Press /rules to read the full written rules.
Verified here means one specific thing: the plot number was found in DHA’s record and the size checked against it. It does not mean we inspected the plot or its papers.
Try it yourself
18

Rankings — the dearest and the busiest blocks

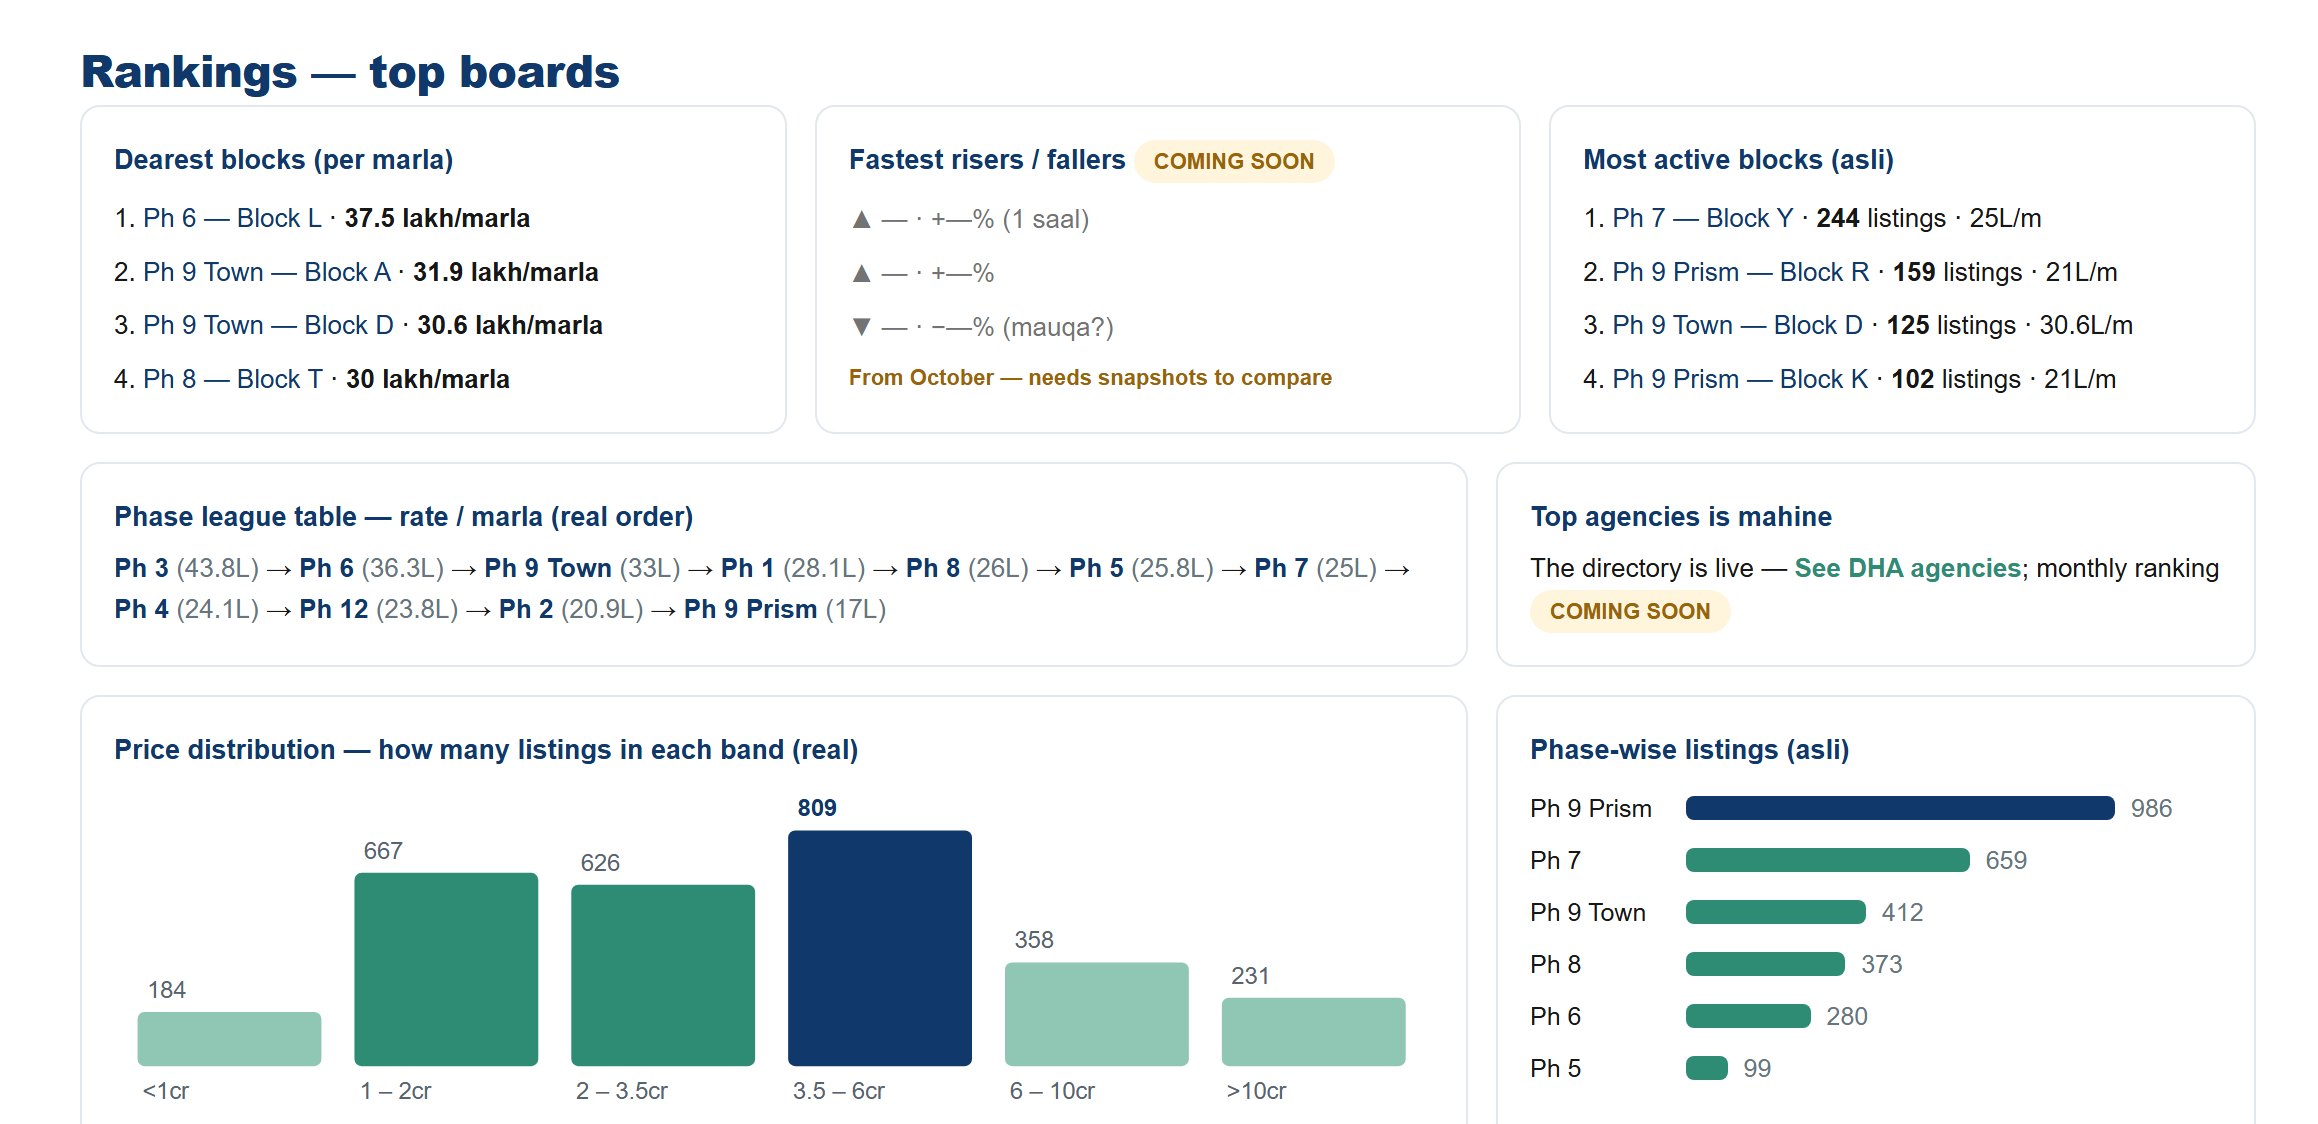
Two short lists that tell you where the money is and where the movement is — and they are not the same blocks.

  1. Dearest blocks — ranked by rate per marla, not by total price.
  2. Busiest blocks — where the most listings are, which usually means where the most trading happens.
  3. Press any block to open that block’s own guide page.
  4. Fastest risers and fallers is marked Coming Soon — it needs two months to compare.
The dearest block and the busiest block are rarely the same. Dear means scarce; busy means it moves. Which one you want depends on why you are buying.
Try it yourself
19

Tools, reports and every rate page

The last three sections are doorways out of the report to the places where you actually work.

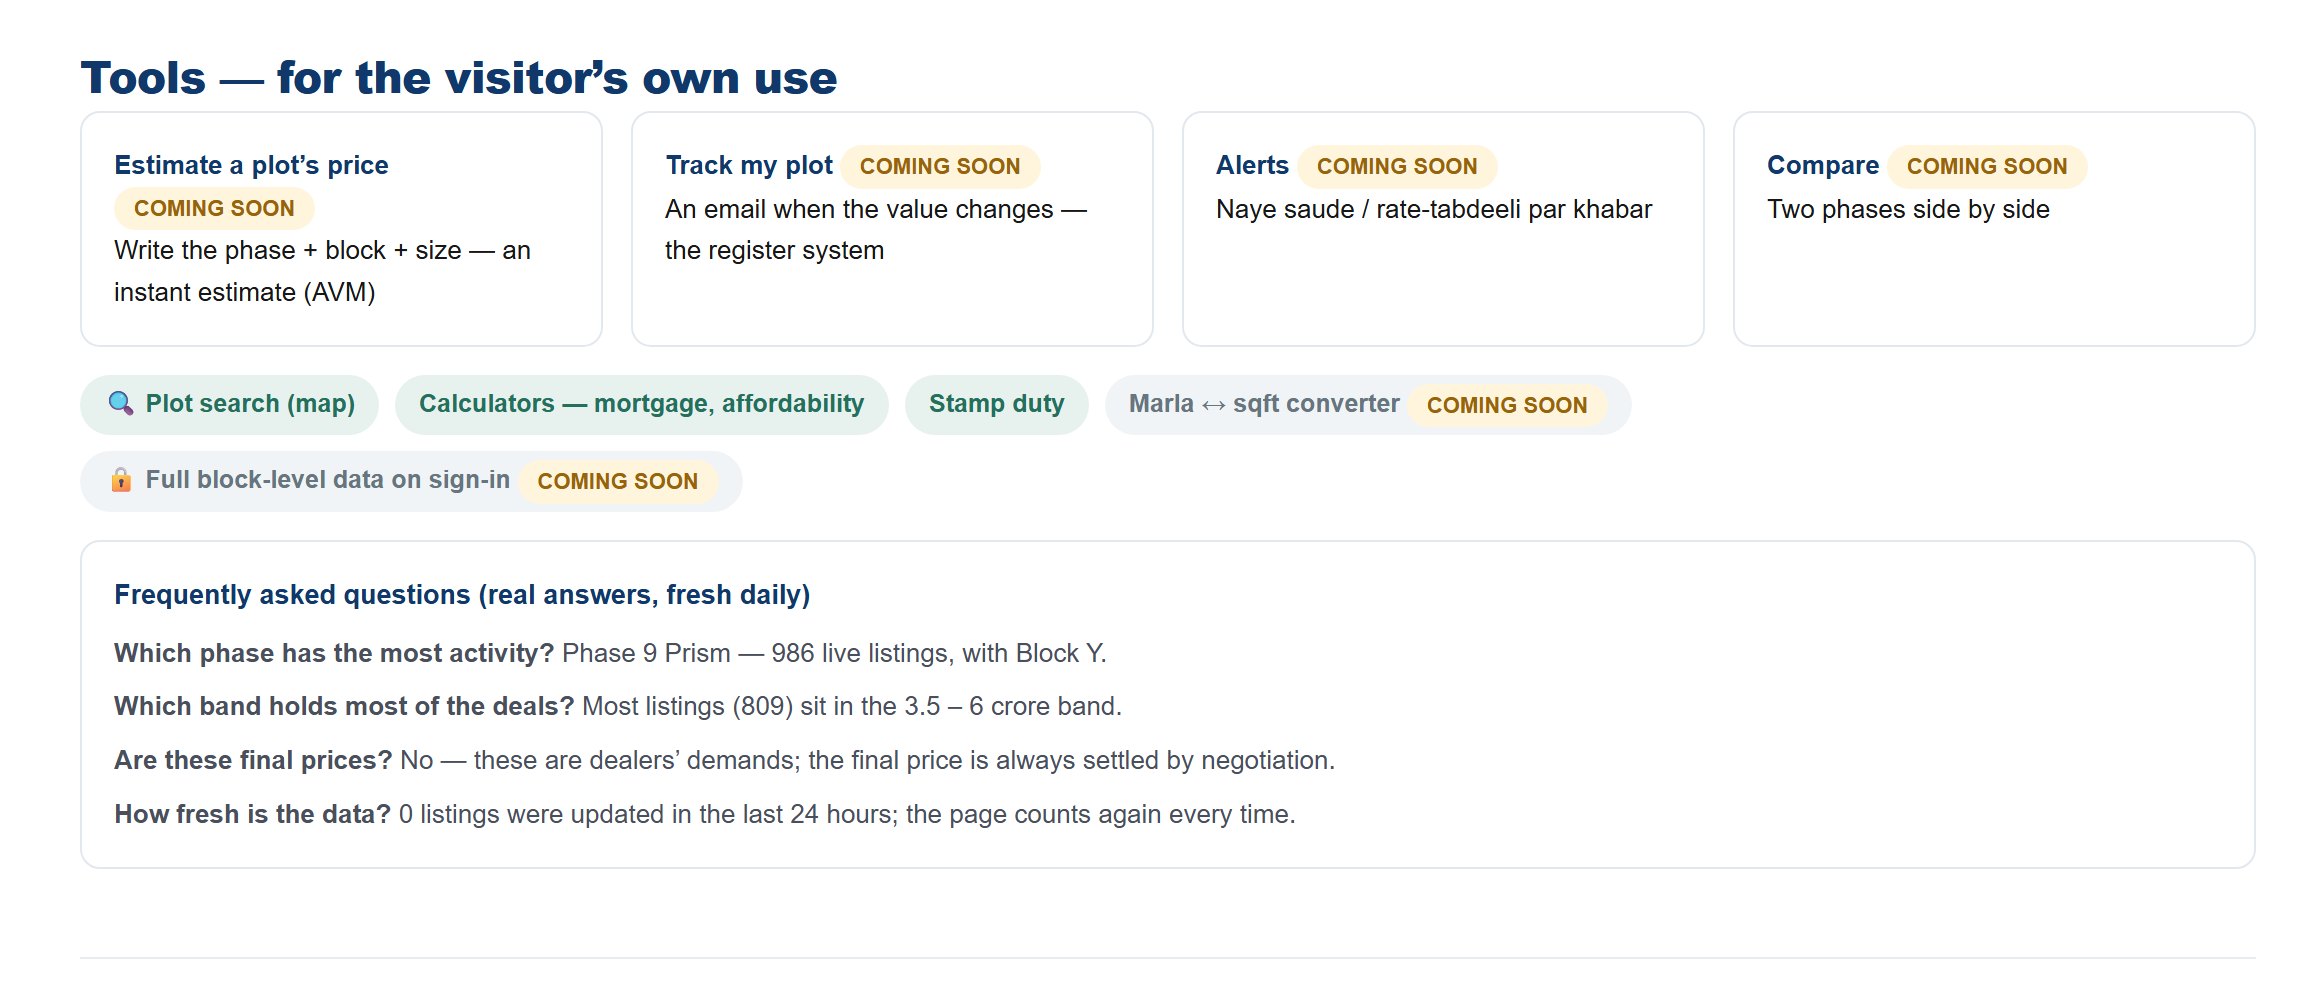
  1. Tools — the Plot Finder map and the calculators are live; an instant price estimate, plot tracking, alerts and phase comparison are Coming Soon.
  2. Reports — a weekly flash, a two-page summary, the monthly PDF and a yearly book, all Coming Soon.
  3. Every phase and size has its own rate page — chips that take you straight to file rates, homes, cheapest plots, corner plots, agents and the map.
  4. Anything without a Coming Soon mark works today.
Read the report to understand the market; use these doorways to act on it.
Try it yourself
20

Where these figures come from

The method section, kept short on the page and honest about its own limits.

  1. Live dealer listings from WhatsApp groups and the portals, cleaned and de-duplicated every day.
  2. Our own field survey of DHA Lahore — walked on foot, block by block.
  3. DHA’s own plot record, used to check every plot number and size we can match.
  4. If the method ever changes, it will be written here — a revision log, not a silent edit.
No figure comes from a paid feed, a partner, or another site’s rate list. If we cannot work it out from our own record, we do not print it.
Try it yourself
06

What this report does not say

10

An honest list. These are the limits of any report built from live listings, and we would rather you knew them.

  • Every price here is an asking price, not a closed deal. What a plot actually sold for is not public in this market — when our own sold-marks build up, that section comes alive.
  • It cannot tell you what a price will do next. There is no forecast on this page and there will not be one.
  • Where a figure is not ready it shows a dash and Coming Soon — the design is there, the data is not. We never fill a gap with a guess.
  • The Price Index needs a full month of daily snapshots before its chart can be drawn.
  • Rent, yield and years-to-recover need a rental pipeline that does not exist yet.
  • Sold pace, months of supply and withdrawn listings all wait on sold data.
  • A box in the size table only appears when it has at least three clean listings — fewer than that is noise, not a rate.
  • Verified means the plot number was found in the DHA record and the size checked. It does not mean we have inspected the plot or the papers.
  • It covers DHA Lahore only.
  • It is a market reading, not advice. What you should pay is your decision.

This guide describes the report exactly as it works today. As each waiting section comes alive, this page is updated with it. 20 functions